


Statistical Process Control
- Prism Philosophy

- Oct 13, 2024
- 2 min read
Statistical Process Control (SPC) is a method used to monitor and control a process to ensure that it operates at its full potential. SPC relies on control charts to track the performance of a process over time and detect any signs of variation. There are different types of control charts depending on the nature of the data being monitored.

Here are the four key types of attribute control charts commonly used in SPC:
1. C Chart (Count of Defects per Unit)
Purpose: Used to monitor the count of defects or nonconformities in a fixed number of units (e.g., defects in a batch of products).
Data Type: Count of defects (attribute data, discrete values).
Example: Tracking the number of scratches on a batch of glass panes.
Control Limits: Based on the Poisson distribution.
Formula for control limits:UCL=Cˉ+3Cˉ,LCL=Cˉ−3CˉUCL=Cˉ+3Cˉ,LCL=Cˉ−3Cˉ where CˉCˉ is the average number of defects.

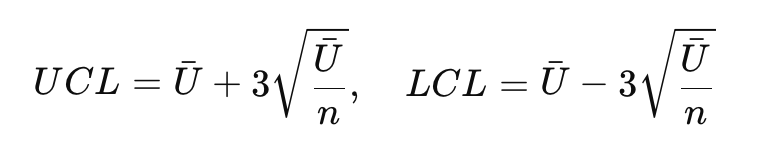
2. U Chart (Defects per Unit)
Purpose: Used to monitor the average number of defects per unit when the sample size varies.
Data Type: Count of defects per unit (attribute data, discrete values).
Example: Monitoring defects per square meter of fabric, where the size of the fabric pieces may vary.
Control Limits: Adjusted for varying sample sizes, also based on the Poisson distribution.
Formula for control limits:UCL=Uˉ+3Uˉn,LCL=Uˉ−3UˉnUCL=Uˉ+3nUˉ,LCL=Uˉ−3nUˉ where UˉUˉ is the average defects per unit and nn is the sample size.
3. P Chart (Proportion of Defectives)
Purpose: Used to monitor the proportion or percentage of defective items in a process where items are either classified as defective or non-defective.
Data Type: Proportion of defectives (attribute data, binomial distribution).
Example: Tracking the proportion of defective light bulbs in a shipment.
Control Limits: Based on the binomial distribution.
Formula for control limits:UCL=Pˉ+3Pˉ(1−Pˉ)n,LCL=Pˉ−3Pˉ(1−Pˉ)nUCL=Pˉ+3nPˉ(1−Pˉ),LCL=Pˉ−3nPˉ(1−Pˉ) where PˉPˉ is the average proportion defective, and nn is the sample size.

4. Np Chart (Number of Defective Units)
Purpose: Used to monitor the number of defective units in a sample of constant size.
Data Type: Number of defectives (attribute data, binomial distribution).
Example: Monitoring the number of defective bottles in a production line where a fixed number of bottles are checked in each sample.
Control Limits: Based on the binomial distribution.
Formula for control limits:UCL=Npˉ+3nPˉ(1−Pˉ),LCL=Npˉ−3nPˉ(1−Pˉ)UCL=Npˉ+3nPˉ(1−Pˉ),LCL=Npˉ−3nPˉ(1−Pˉ) where NpˉNpˉ is the average number of defectives, PˉPˉ is the proportion defective, and nn is the sample size.

Summary of Use:
C Chart: Use for the count of defects in a fixed number of units.
U Chart: Use for defects per unit when the sample size is not constant.
P Chart: Use for the proportion of defectives in samples of varying sizes.
Np Chart: Use for the number of defective items when the sample size is constant.
These charts help detect whether a process is in control (i.e., only random variation is present) or out of control (i.e., due to special causes that should be investigated)


Comments